Loading crash and ACE data...
Animated disc
Crashes
ACE
Congestion Zone
ACE Routes
Non-ACE Routes

MTA LogoNYC Bus ACE Analysis

1 / 18
NYC Bus System & ACE

The New York City bus system serves over a million riders per day. Despite this, the system is plagued with delays and crawling speeds, partially due to illegally parked vehicles obstructing the buses' path.

One method employed by the MTA to combat this is Automated Camera Enforcement (ACE).

Three key questions:

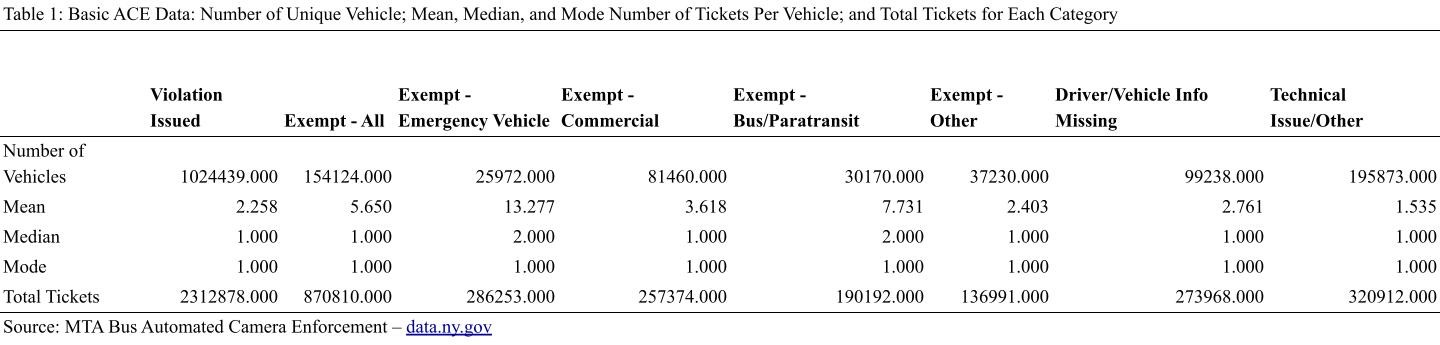
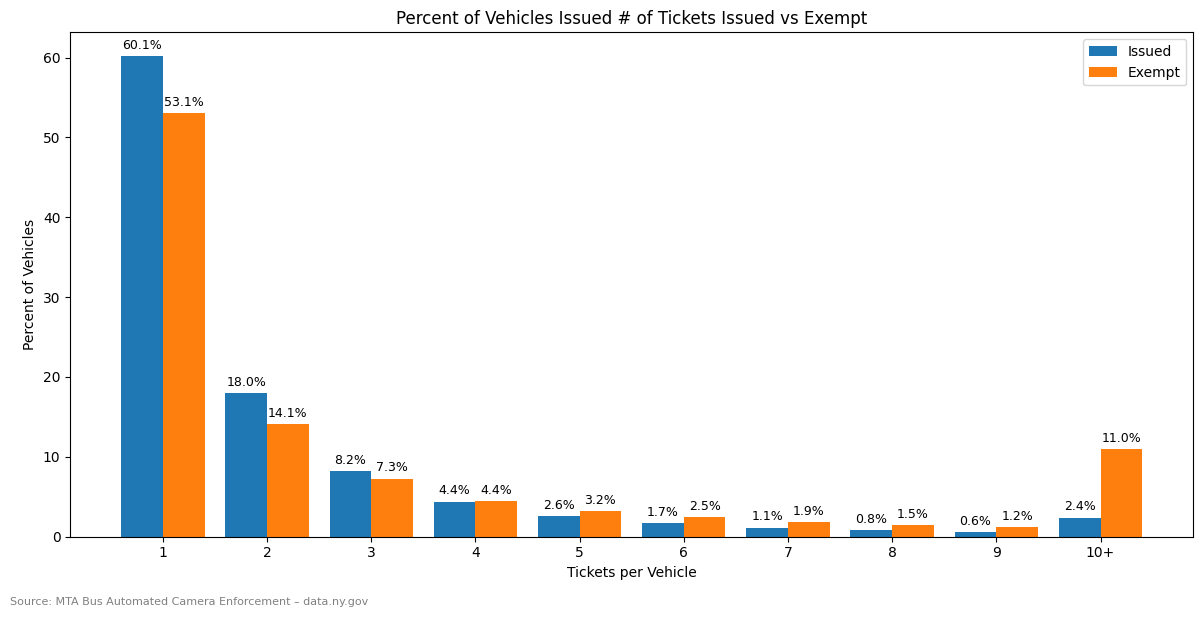
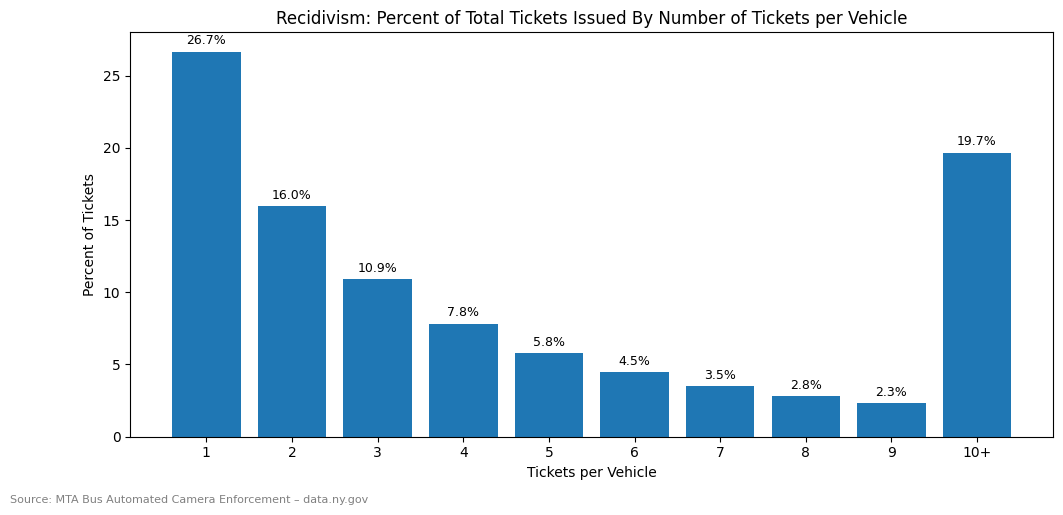
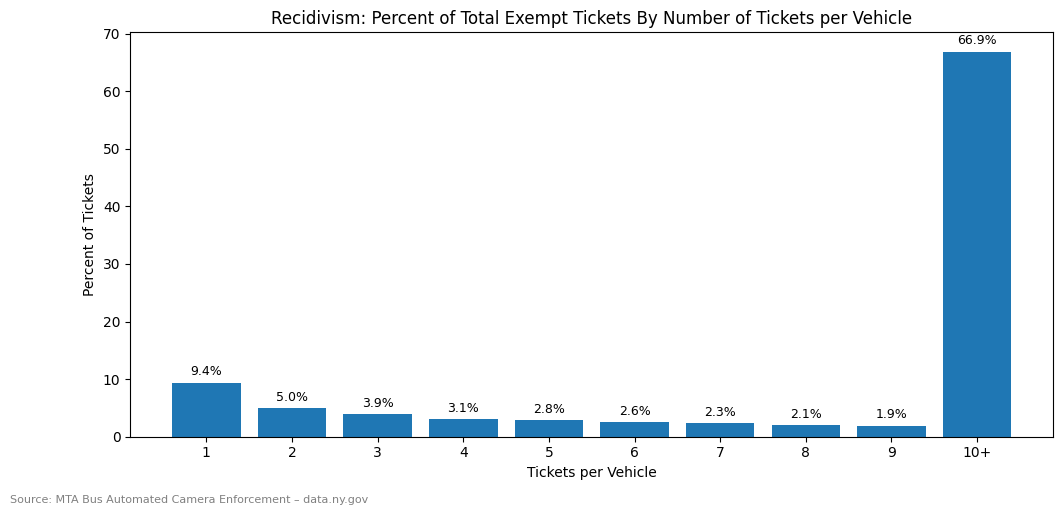
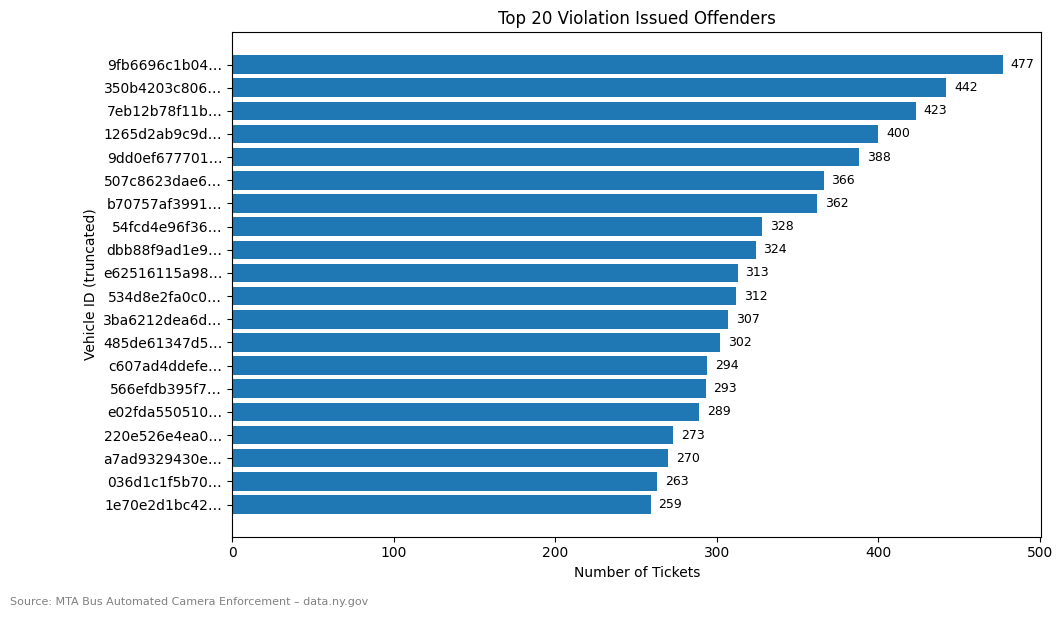
  1. What is the recidivism rate of ticketed vehicles?
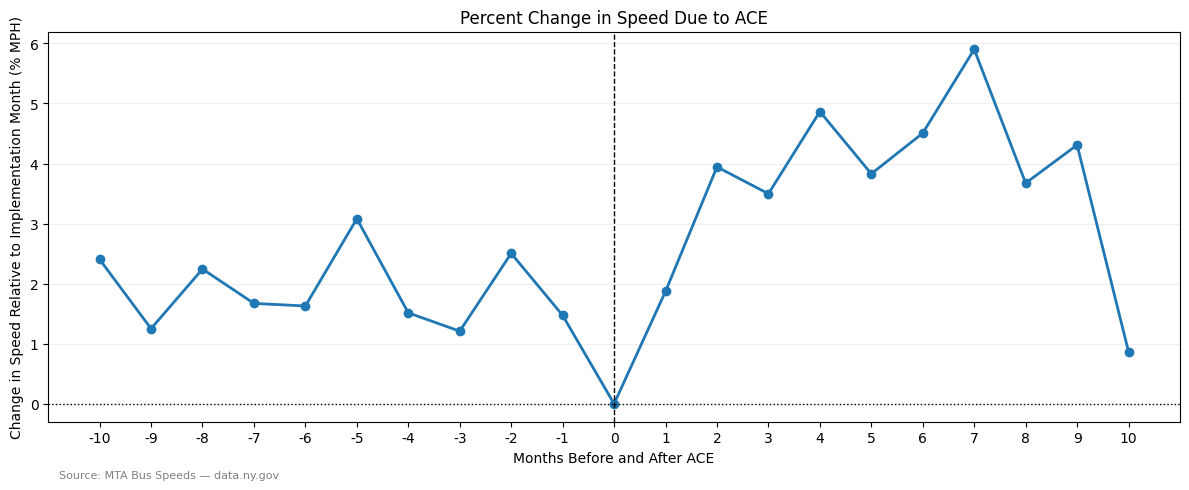
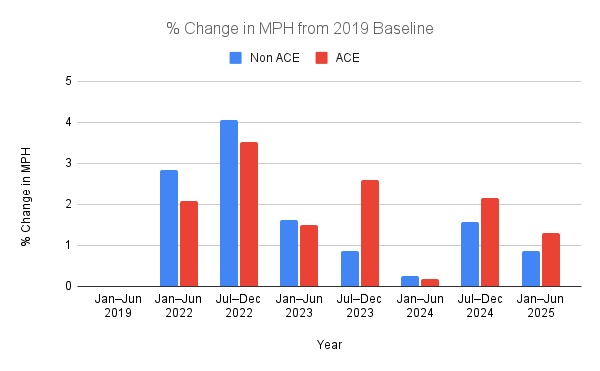
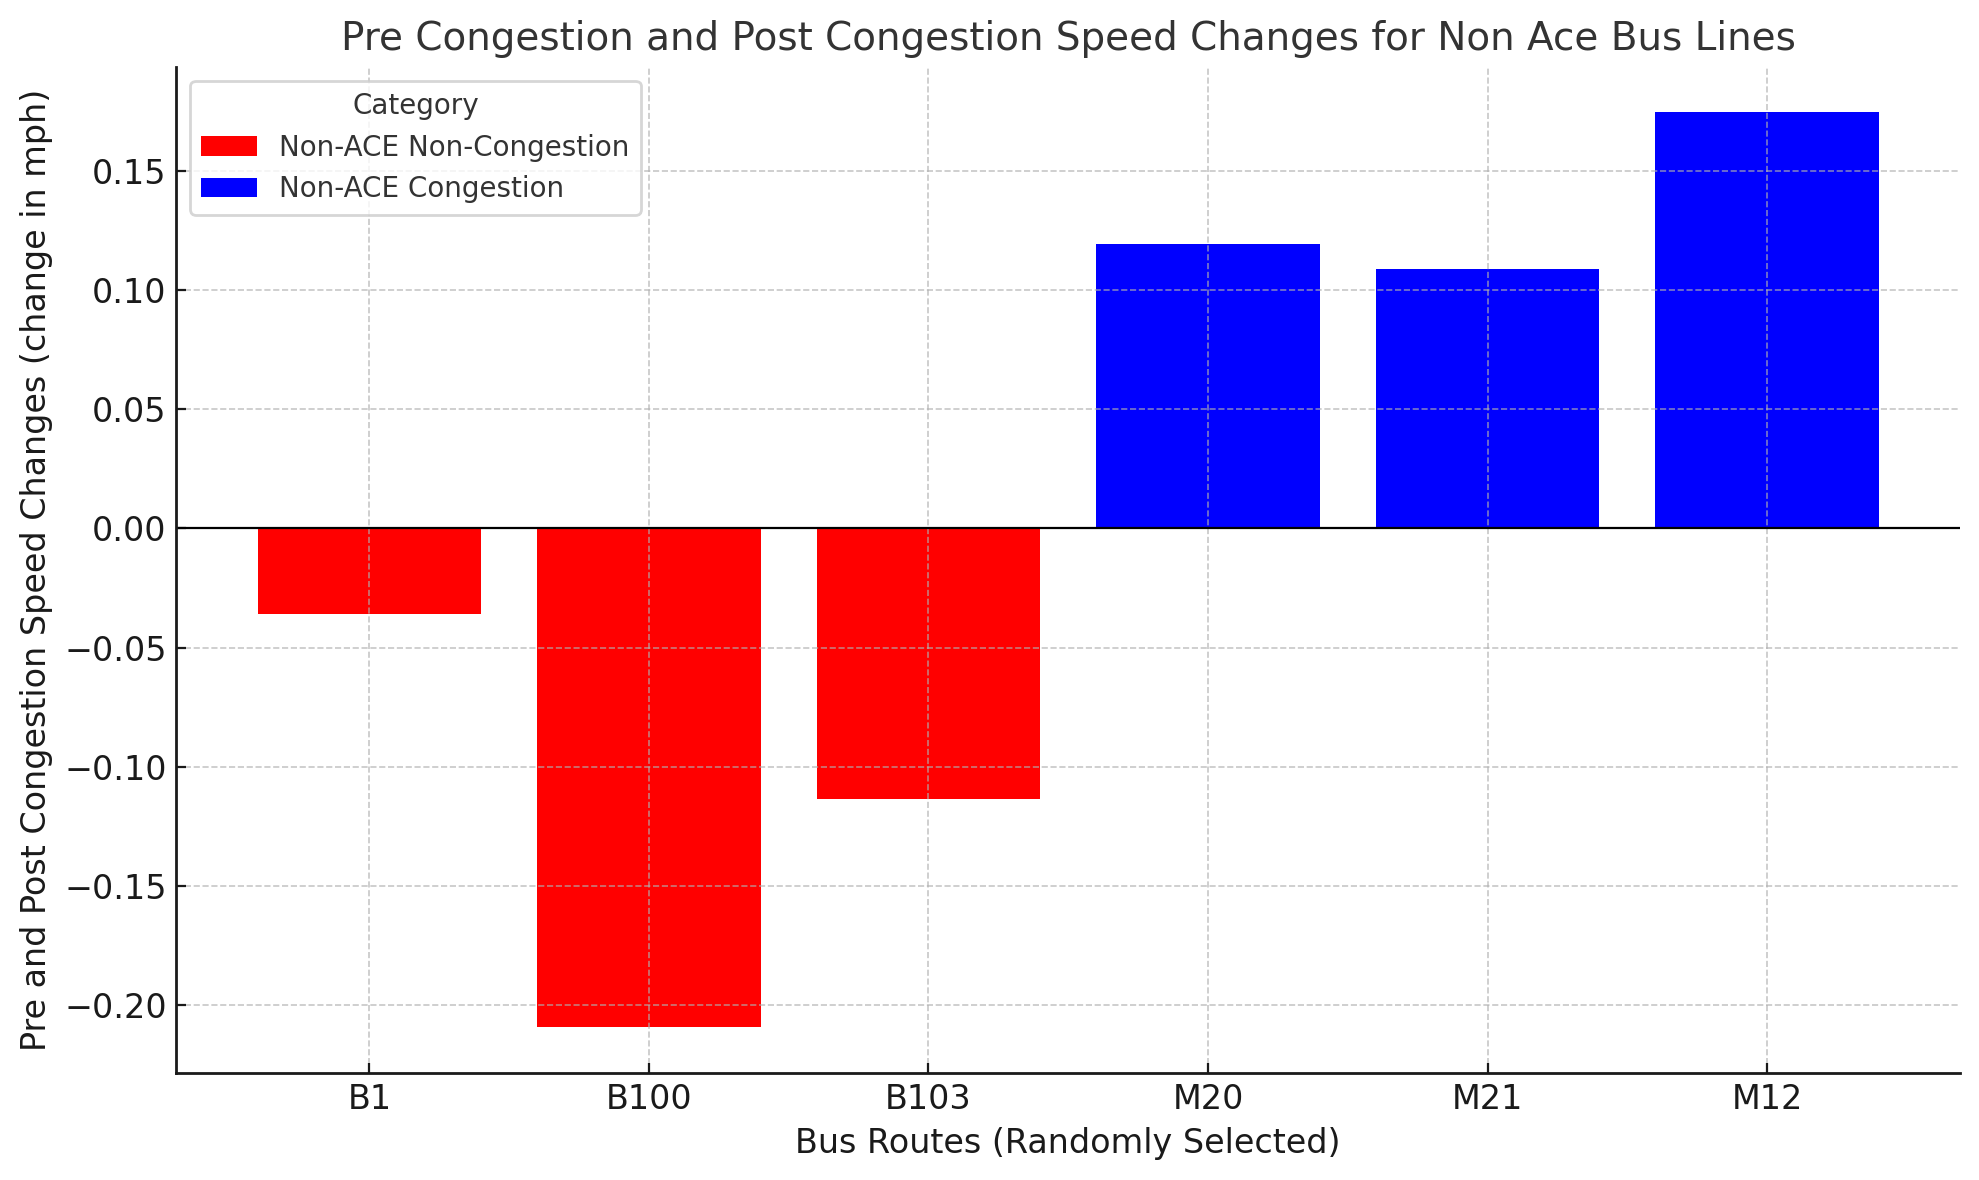
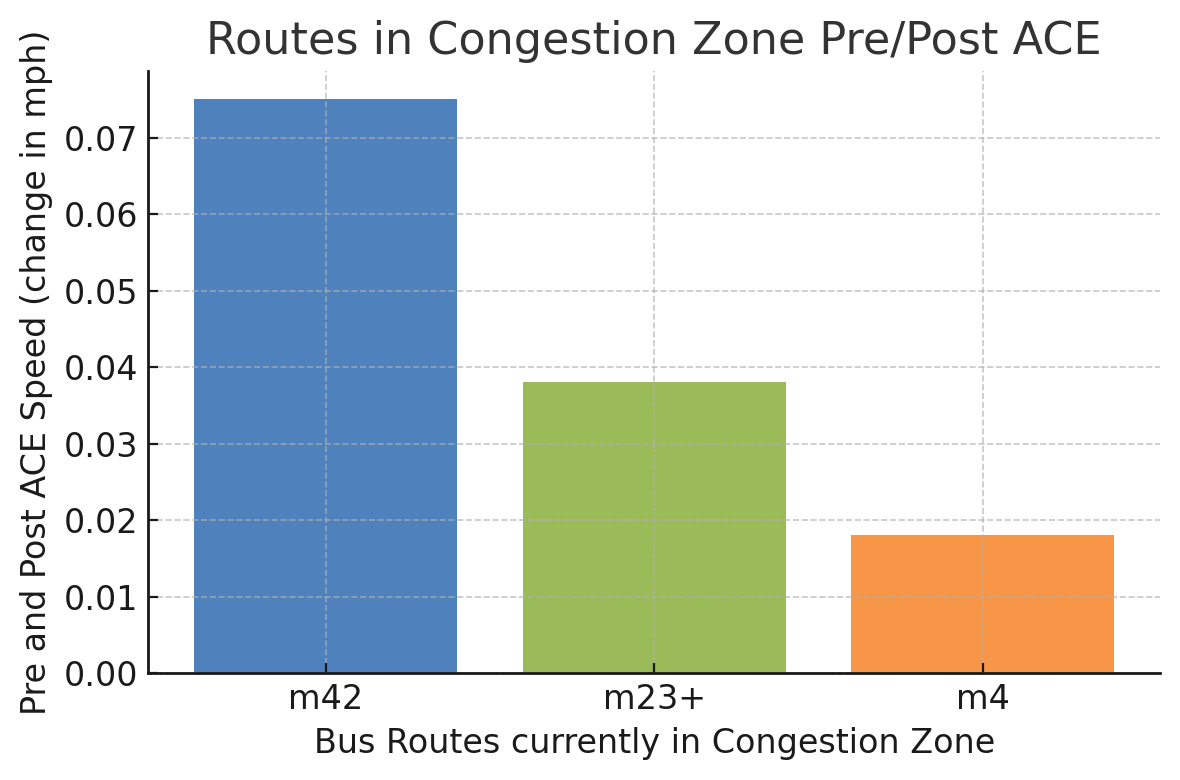
  2. How has ACE affected bus speeds vs non-ACE routes?
  3. Has ACE reduced accidents?
↓ Scroll to explore our analysis
What is ACE?

ACE is the MTA's automated camera enforcement system. In mid-2024, the existing ABLE ticketing system was expanded into ACE.

ABLE (Automated Bus Lane Enforcement) only ticketed vehicles blocking bus lanes or stops.

ACE expanded to include double-parked and other illegally parked vehicles.

How it works: If two buses record a vehicle engaging in illegal parking behavior more than 5 minutes apart, the vehicle receives a $50 ticket. Each subsequent ticket increases by $50 until reaching the $250 cap.
Ticketing Recidivism

ACE violations are broken down into 7 categories:

  1. Violation Issued
  2. Exempt: Emergency Vehicle
  3. Exempt: Small Commercial Vehicle
  4. Exempt: Bus/Paratransit Service
  5. Exempt: Other
  6. Driver/Vehicle Info Missing (no ticket)
  7. Technical Issue/Other (no ticket)

For analysis, exempt categories are generally grouped together.

Basic ACE Statistics
Key Finding: Over 1 million unique cars received violations, with 2.3 million total tickets issued.

The median and mode is 1 ticket per vehicle, but the mean is 2.26 - indicating a small group of repeat offenders driving up the average.

Emergency vehicles and Paratransit have significantly higher averages (13.3 and 7.7 tickets respectively), suggesting structural issues in city space allocation.

Basic ACE Statistics
Vehicle Ticket Distribution

60.1% of vehicles received only one ticket

2.4% of vehicles received more than 10 tickets

For exempt vehicles: 11% received over 10 violations

Ticket Distribution Analysis
Recidivism Violations
Despite only 2.4% of vehicles receiving 10+ tickets, they account for 19.7% of all tickets issued.

Almost half of all tickets went to vehicles with 4+ prior tickets, despite being only 13.6% of total vehicles.

Exempt Vehicle Analysis
Exempt Recidivism
66.9% of all exempt violations were given to vehicles with 10+ prior instances.

This indicates structural issues in the city regarding space allocation as Paratransit, commercial, and emergency vehicles are forced into violating parking laws.

Top 20 Violators
Top 20 Violators
Violations by Route & Month
Monthly Violations

Pattern observed: Spike in tickets May-September 2024 (ABLE to ACE transition) and March-April 2025 (ACE expansion).

BX19 and M101 have the highest number of tickets by far.

Exempt Vehicle Patterns
Exempt Vehicle Violations by Route

The exempt data is similar in its spikes but not in the trough. This is likely because they are (rightfully) not punished for violations and further confirms a structural issue.

Solutions

These results are similar to speed camera data. There is a small portion of "super speeders" that contribute a disproportionate number of violations. We can look to proposed speeding solutions and apply them here.

Potential solutions require changes to the fine structure, passage of state laws, and partnership with the DOT.

We propose:

Harsher Fines

The 5th fine is the same value as the 105th fine. The $250 cap should be raised to further disincentivize illegal behavior.

MTA should partner with NYPD to further crack down on unpaid tickets.

Vehicle Modification Through State Law

Currently, a "super speeder" bill has been proposed in the state legislature that would impose harsher penalties on frequent offenders. A similar bill could be adopted.

Street Redesigns

MTA should further its partnership with DOT by dedicating more street space along highly fined routes (BX19, M101, BX36) to the exempt usages.

A certain number of parking spots along commercial corridors should be dedicated commercial loading zones.

Emergency vehicle only lanes should be created on certain wide streets, especially where respond times are long and potentially life threatening. This removes vehicles from conflicting with buses.

Impact on Speed

To assess the impact of ACE, we examined speed changes along ACE bus routes and compared them to several benchmarks: ACE routes before implementation, non-ACE routes to test for system-wide effects, and routes within the Central Business District (CBD) subject to congestion pricing to capture their combined influence.

Key Finding: Both congestion pricing and ACE improve bus speeds, and their benefits are cumulative. However, congestion pricing exerts a stronger effect on overall bus performance.
ACE Speed Change Analysis
ACE Speed Improvements

This time-series chart shows the percent change in speed across the aggregate of all 43 ACE routes from before ACE was implemented on the route to after. The middle 0 point is when ACE was implemented.

The line dips just before implementation but quickly climbs afterward, averaging around a 4-5% gain in speed.

This implies ACE is correlated with faster bus speeds that sustain for almost a year. The drop off at the 10-month mark is likely due to data and coding-related issues rather than sharp speed declines. However, we still need to compare it to non-ACE routes.

Change in MPH from 2019 Baseline
Non-ACE Route Deep Analysis

To deepen the analysis of ACE and congestion pricing, we randomly selected six non-ACE bus routes: three within the congestion zone and three in Brooklyn, outside the zone. The results reveal a clear divide.

All three congestion-zone routes show notable speed gains, with the M12 improving by more than 0.15 mph. By contrast, all three Brooklyn routes experienced considerable speed declines.

This pattern suggests that congestion pricing effectively reduced traffic volumes in the CBD, leading to faster bus travel.

Importantly, these findings do not imply that traffic was simply displaced elsewhere. The B1 and B100 corridors are located far from the CBD and do not directly intersect with it, making it unlikely that congestion shifted to those areas. Instead, the data points toward congestion pricing having a localized effect: easing traffic within the CBD without producing offsetting increases in peripheral corridors.

Pre-Post Congestion on Non-ACE Routes
Route Comparison Analysis

We analyzed six non-ACE bus routes: three within the congestion zone and three in Brooklyn. We also examined three CBD routes without ACE until later in the year.

Key Findings: All congestion-zone routes show speed gains (M12 +0.15 mph, M42 +0.07 mph), while Brooklyn routes experienced declines.

This confirms congestion pricing effectively reduced CBD traffic without displacing it to peripheral areas.

Pre and Post ACE Routes in Congestion Zone
Did ACE Reduce Accidents?

We analyzed the impact of ACE on car accidents and fatalities.

Hypothesis: ACE expansion would have a noticeable reduction in the number of car crashes and fatalities.

Red light and speeding cameras, other forms of automated enforcement, have been proven to reduce crashes. We hypothesized a similar effect from ACE.

Accident Analysis Results
Finding: Our data shows ACE has minimal, if any, impact on accidents.

Illegal parking does not seem to have the dangerous effect on roads that speeding or red light violations do, which is understandable. Speeding inherently makes crashes more dangerous and red light violations inherently raise the chance of a crash.

Illegal parking makes roads less efficient, potentially slowing down speeds.

However, our analysis is incomplete. Perhaps as all forms of traffic recovered from COVID accidents would've risen if ACE was not in place. Further research is needed.

Conclusion

Key Findings:

  • High recidivism among small group of "super parkers"
  • Structural issues force exempt vehicles into violations
  • ACE improves bus efficiency with 4-5% speed gains
  • Congestion pricing shows stronger effect than ACE alone
  • ACE has minimal impact on accident reduction
  • Solutions require policy changes and street redesigns
Further research needed: Post-COVID traffic recovery analysis and long-term ACE effectiveness studies.