Analysis Overview:
In this section, we present our data analysis of ACE violations on the M101 route. We created visualizations to identify trends, repeat offenders, and violation hotspots.
Tech Tools Used:
- 🐍 Python: used pandas and matplotlib for data analysis and visualization
- 📝 HTML/CSS: used to build this website!
- 🕷️ Spyder IDE: one of the IDEs used to write code
- 🪐 Jupyter Notebook: one of the IDEs used to write code
- 🖥️ Google Slides: used to present our findings
- 👩🏽💻 GitHub Pages: used to host our project!
Graphs & Visualizations:
Top Status Violations, Type Violations, & Stop Name Violations
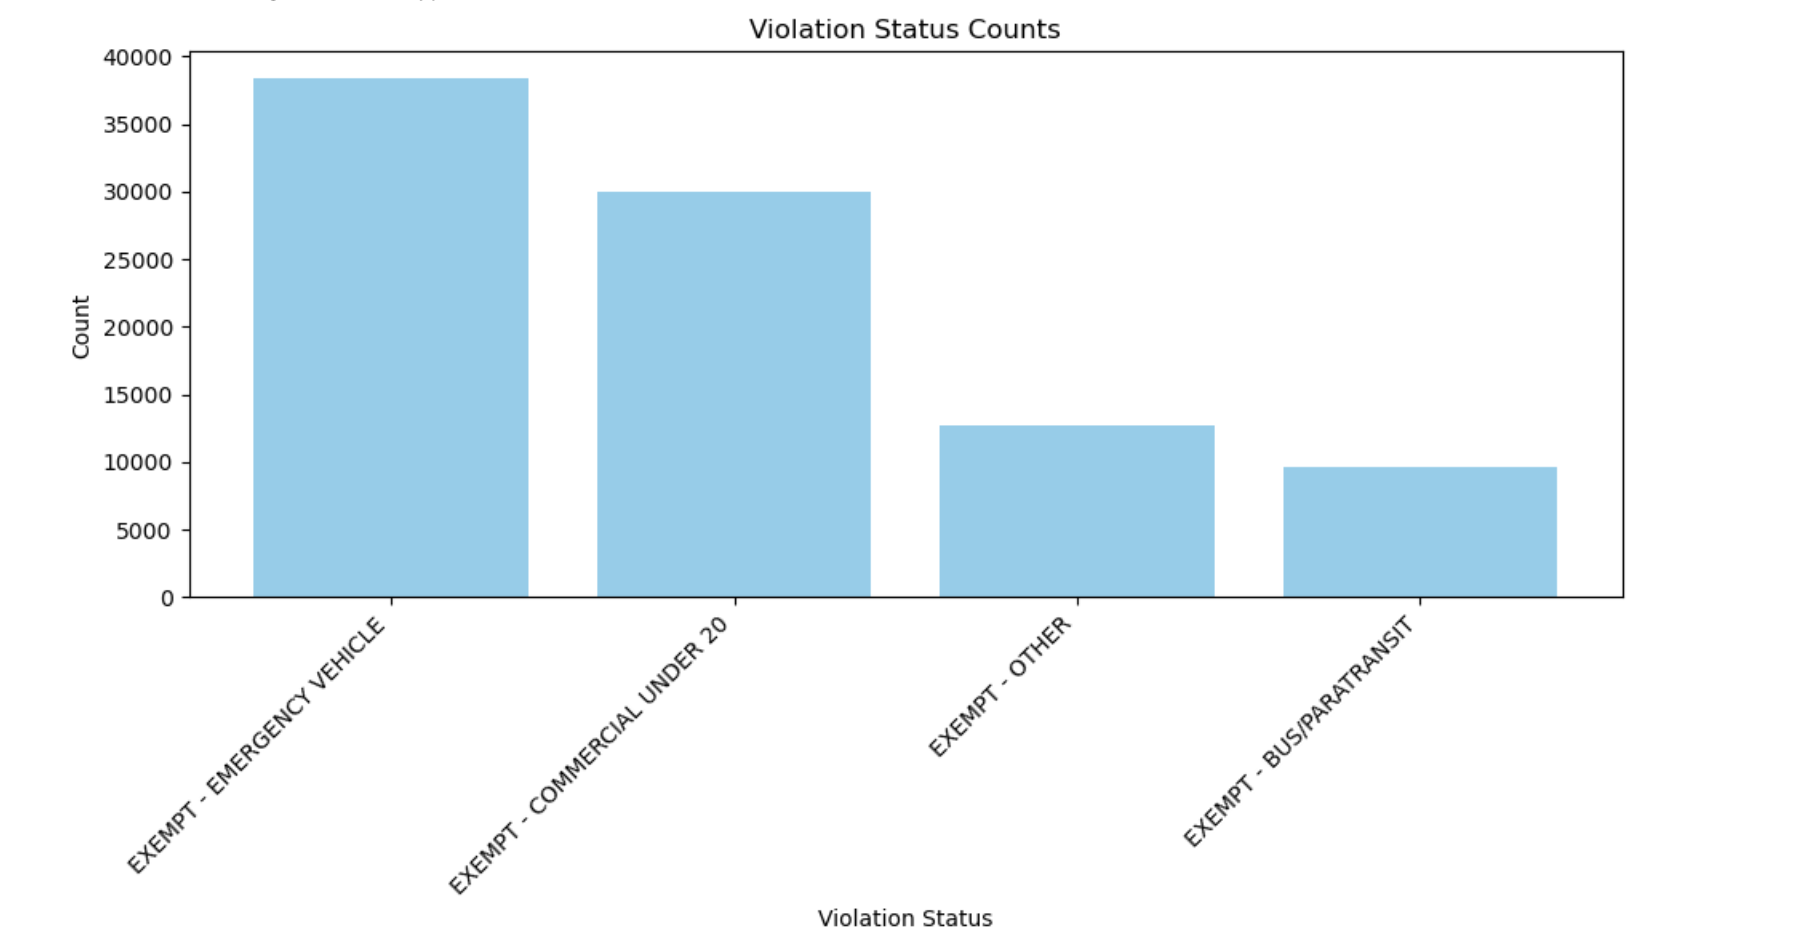
The first bar graph shows the distribution of ACE violations by status, with emergency vehicles making up the largest share of exempt violations, followed closely by commercial vehicles. This makes sense given that the M101 route passes through Manhattan, a densely populated area with several hospitals, police precincts, and other critical facilities where emergency services are frequently needed. On the other hand, the high number of commercial vehicle exemptions suggests that these drivers may feel more freedom to remain in bus lanes without consequence. This not only slows down public transit but also reduces the effectiveness of the ACE cameras. Can this be mitigated? We raise the question here of whether stricter rules for commercial vehicles could help address this issue.
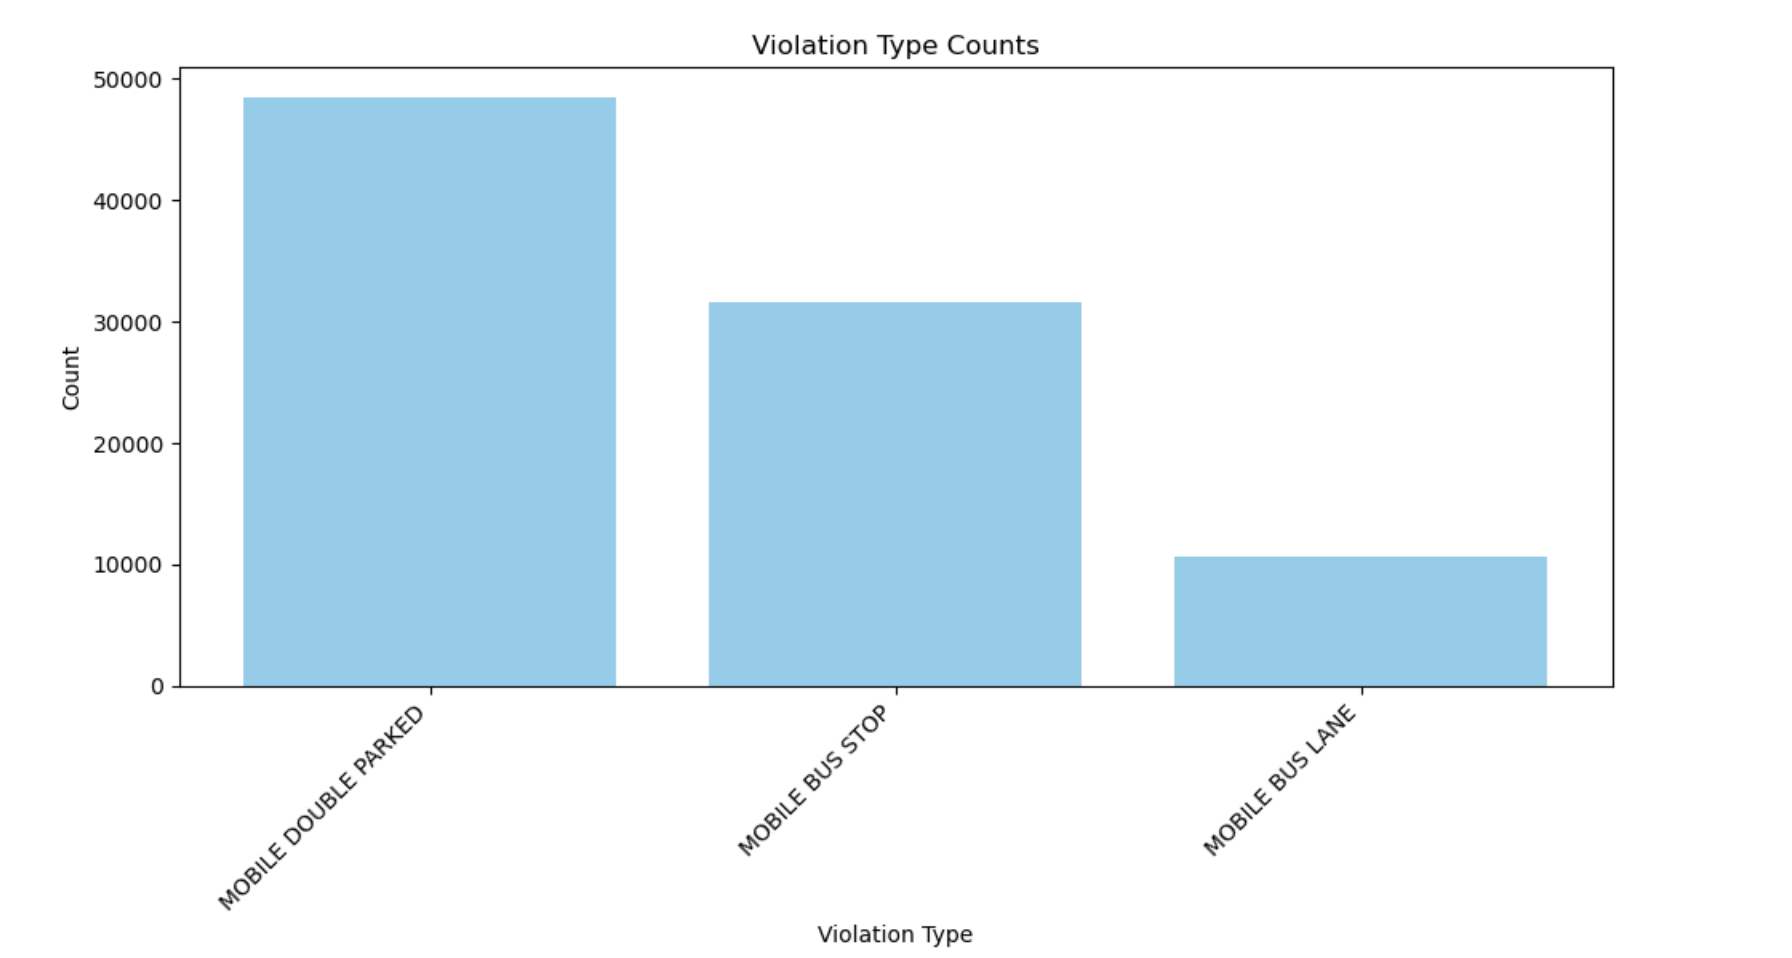
In this bar graph, we see that 53.42% of all violations on the M101 route are caused by vehicles double parking. This is likely due to the route running along narrow one-way streets in congested areas, including busy tourist zones such as Lexington Avenue near 59th and 50th Street. These conditions often lead drivers to use bus lanes for double parking, which disrupts traffic flow and delays buses. Can this also be mitigated?
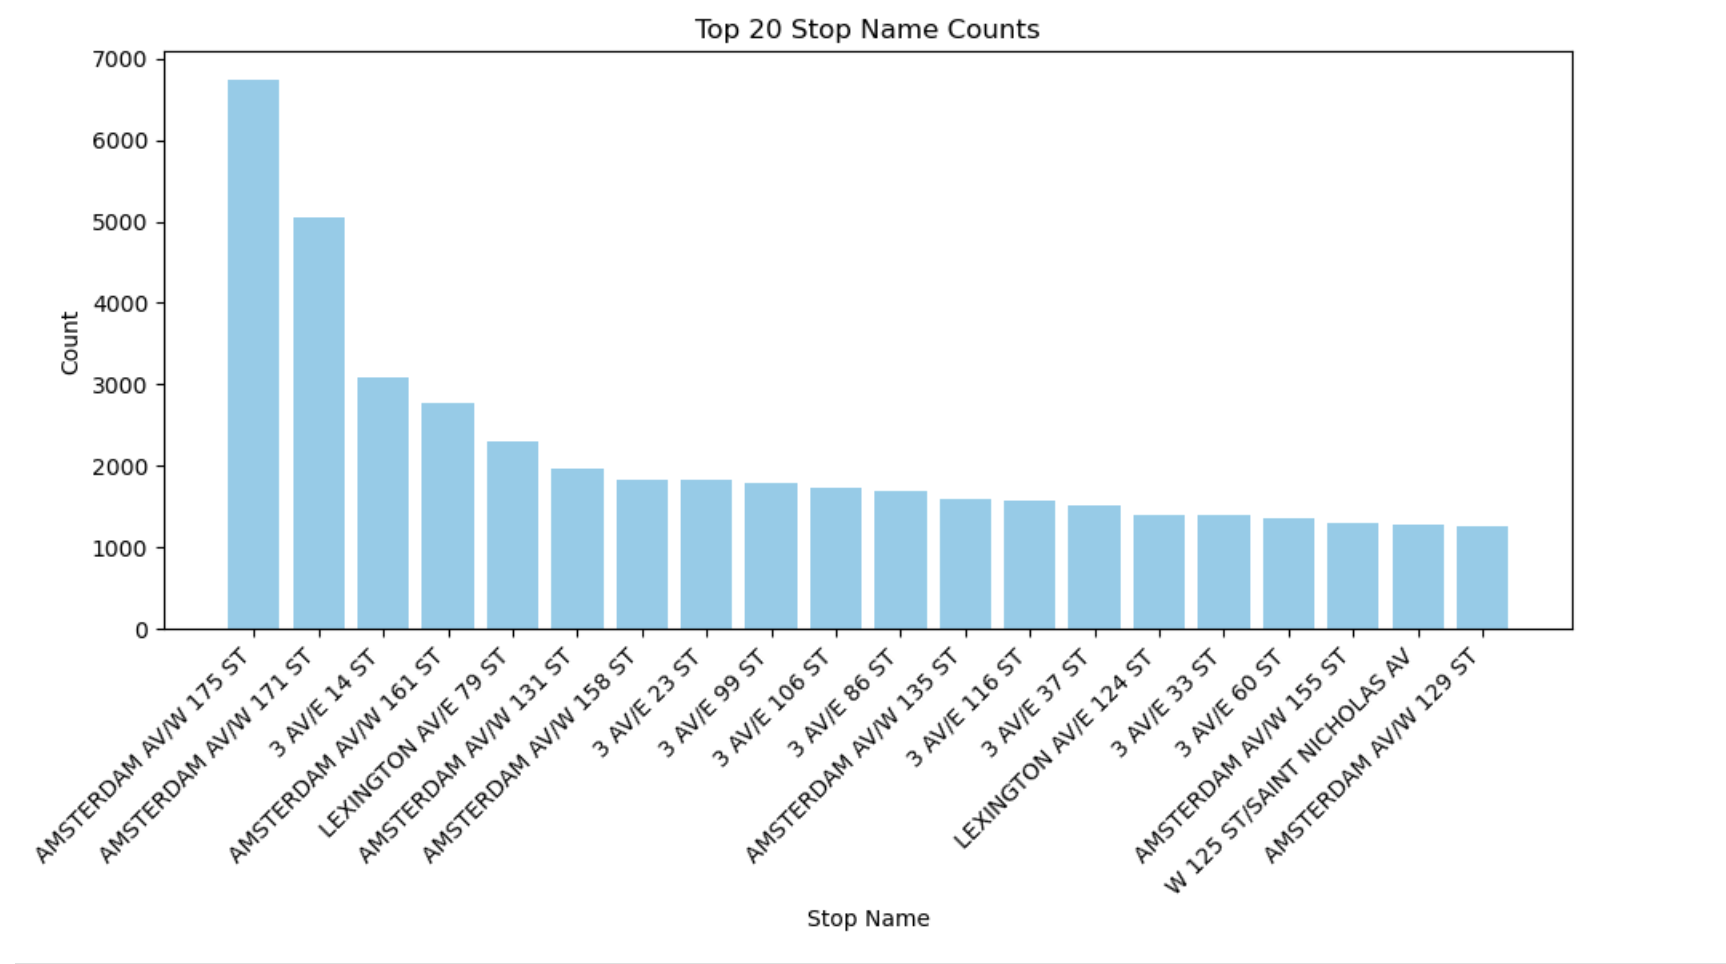
Our analysis highlighted two major hotspots for exempt violations along the M101 route: 3rd Avenue and Amsterdam Avenue. Around 45% of violations occur on 3rd Avenue, while 40% of stop names are concentrated on Amsterdam Avenue. These areas are home to several hospitals, EMS stations, police precincts, urgent cares, and commercial businesses, which explains the high presence of ambulances, police vehicles, and commercial traffic. Many of these exempt vehicles are repeat offenders, often flagged for “mobile double parking” as they use bus lanes during their operations. Because their violations are waived, these drivers face no deterrent and continue the behavior. Together, these two hotspots show how the mix of emergency services, commercial activity, and congestion along the M101 route contributes to consistently high exempt violation counts.
Violations by Time of Day
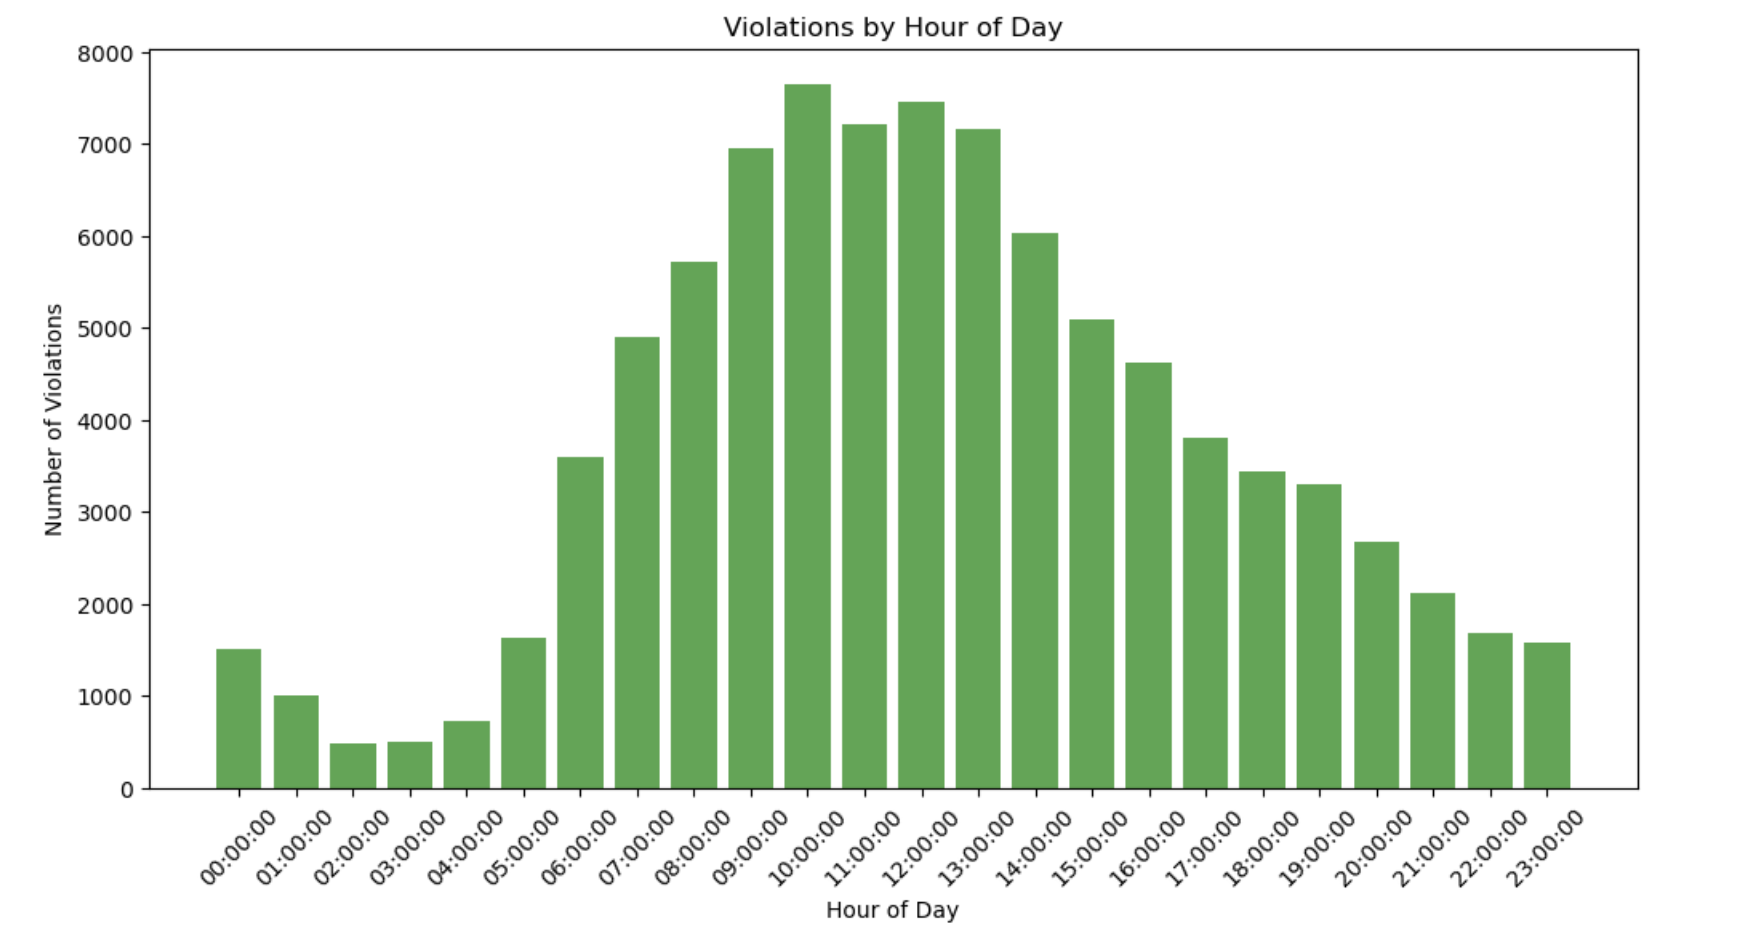
This graph displays the number of ACE violations (in thousands) for each hour of the day along the M101 bus route. The distribution is fairly symmetrical and unimodal, with a clear peak between 8:00 AM and 12:00 PM, and the highest number of violations occurring around 10:00 AM—up to 7,500 exempt violations during this hour. The symmetry of the graph suggests that violation frequency gradually increases during the morning, peaks around mid-morning, and then declines in the afternoon and evening. This pattern aligns with typical rush-hour traffic, when streets are most congested and the likelihood of traffic infractions rises. Understanding this temporal pattern helps identify critical periods for enforcement and can guide strategies to reduce violations during peak hours.
Repeat Offenders Comparison
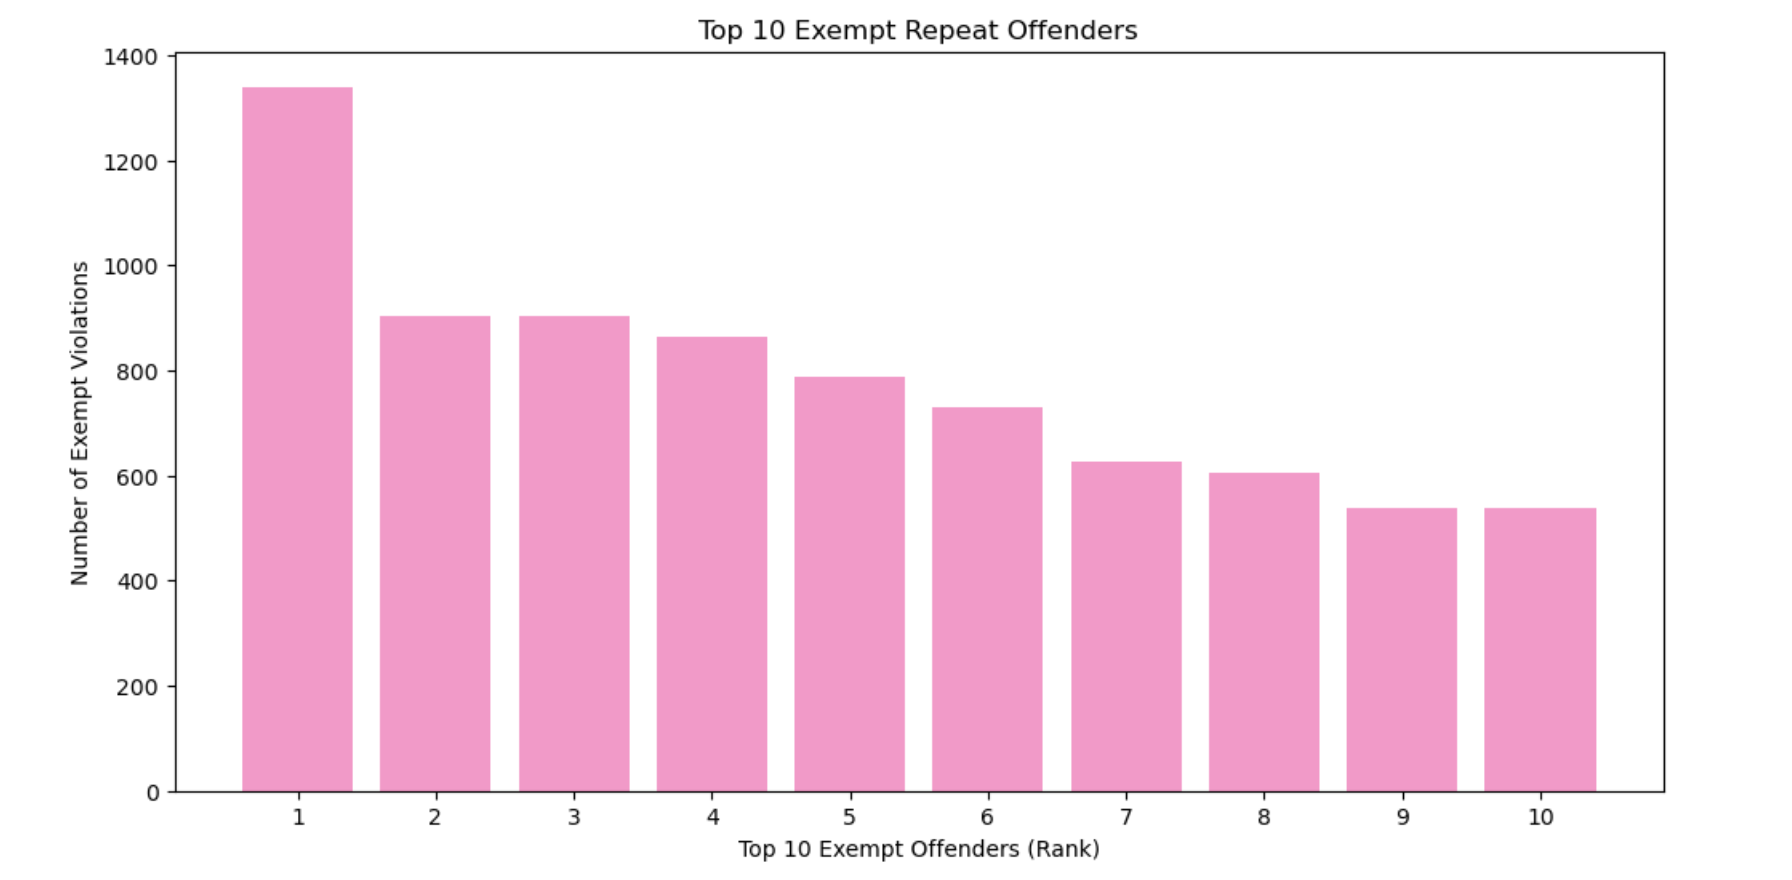
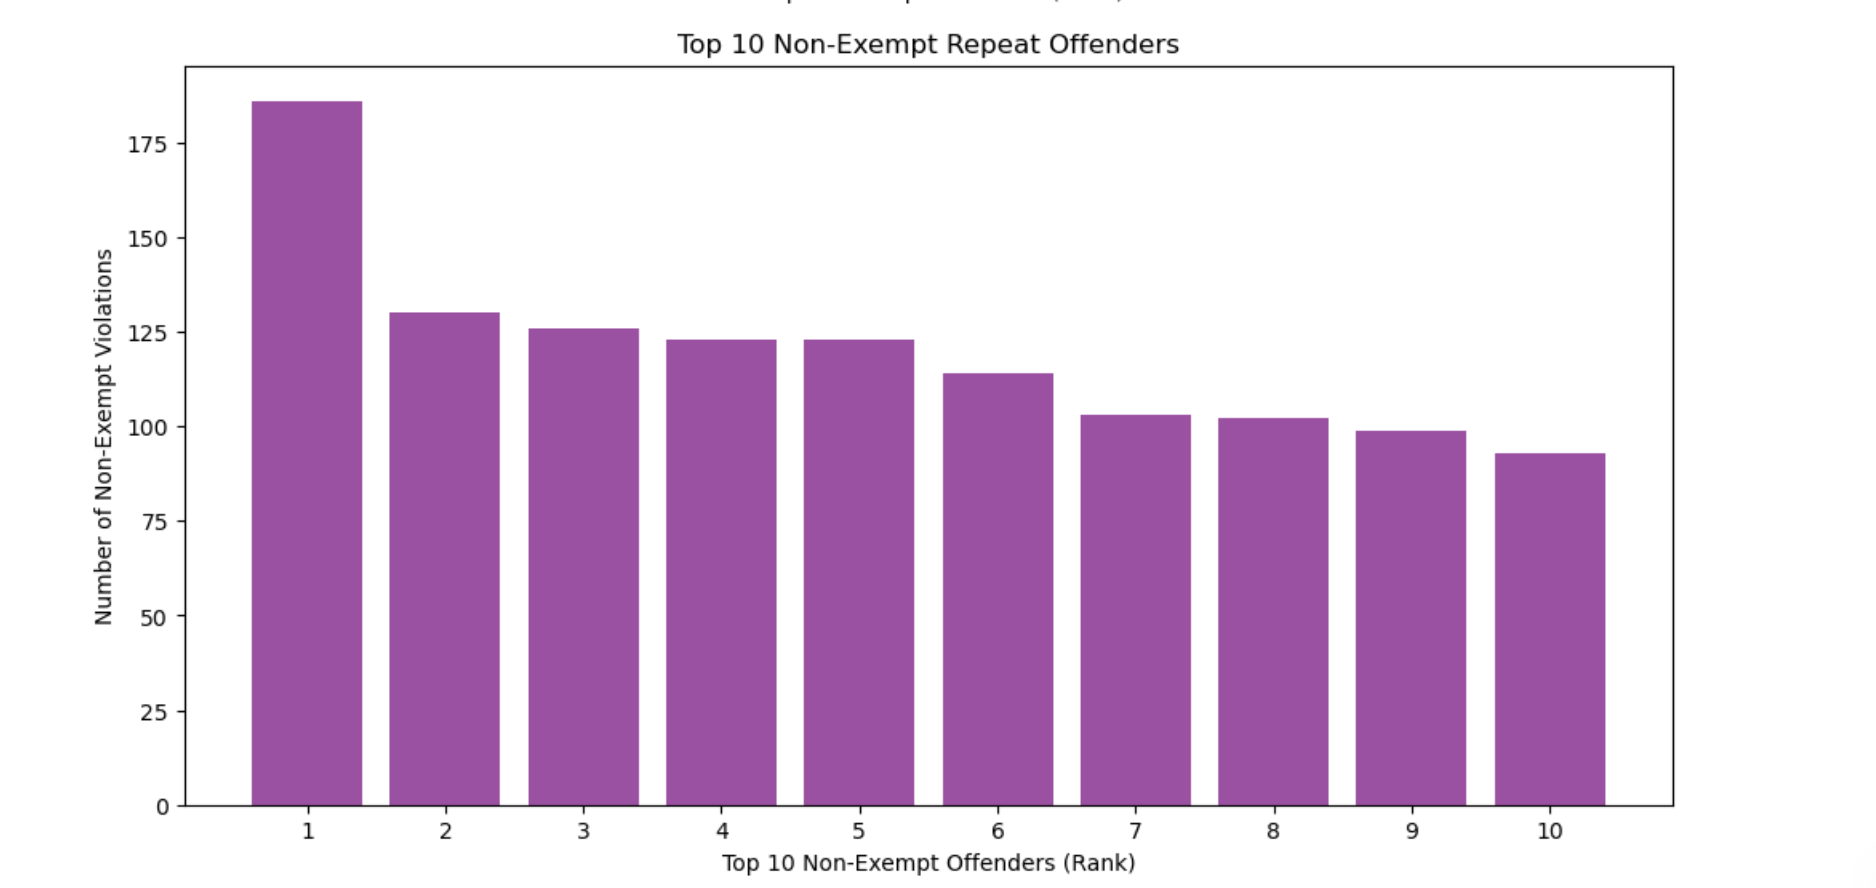
Both exempt and issued violations are represented using bar graphs. For exempt violations, the top repeat offenders appear in the hundreds to thousands, indicating a much higher frequency of violations. In contrast, the top repeat offenders for issued violations are just over 175, with all other values significantly lower. This contrast demonstrates that exempt violations occur far more frequently than issued violations. Analyzing these patterns helps identify which buses or drivers most often commit violations and provides insight into enforcement effectiveness and areas of higher risk.